Website Design
I coded this website entirely on my own, using HTML, CSS, and JavaScript. This is not my first website design experience.
Inscape
As of September of 2023, Inscape's website is my design via Wix.
I also made a website for my high school Robotics team, as well as a couple projects from my high school HTML class. Unfortunately, I do not have access to these files (If you do, please contact me!).
Python and JupyterNotebook
I have done a number of projects in python and JupyterNotebook, but I have the most notable ones listed here.
I worked with Dr. Cawthon over the Summer of 2022, Spring of 2023, and this Fall (2023) using python and JupyterNotebook to do work for the Dark Energy Survey. This past May, I gave a presentation at Duke Colloquium. The video of this presentation is available for you to watch below.
The Dark Energy Survey is an international collaboration of Astronomers (and other scientists) interested in understanding Dark Energy and Dark Matter present in the universe. I contributed over the summer by analyzing the impacts of contaminants like clouds or space dust on our images of space. Now, I'm working on simulated data to further understand inaccuracies in our distance measurements.
RStudio
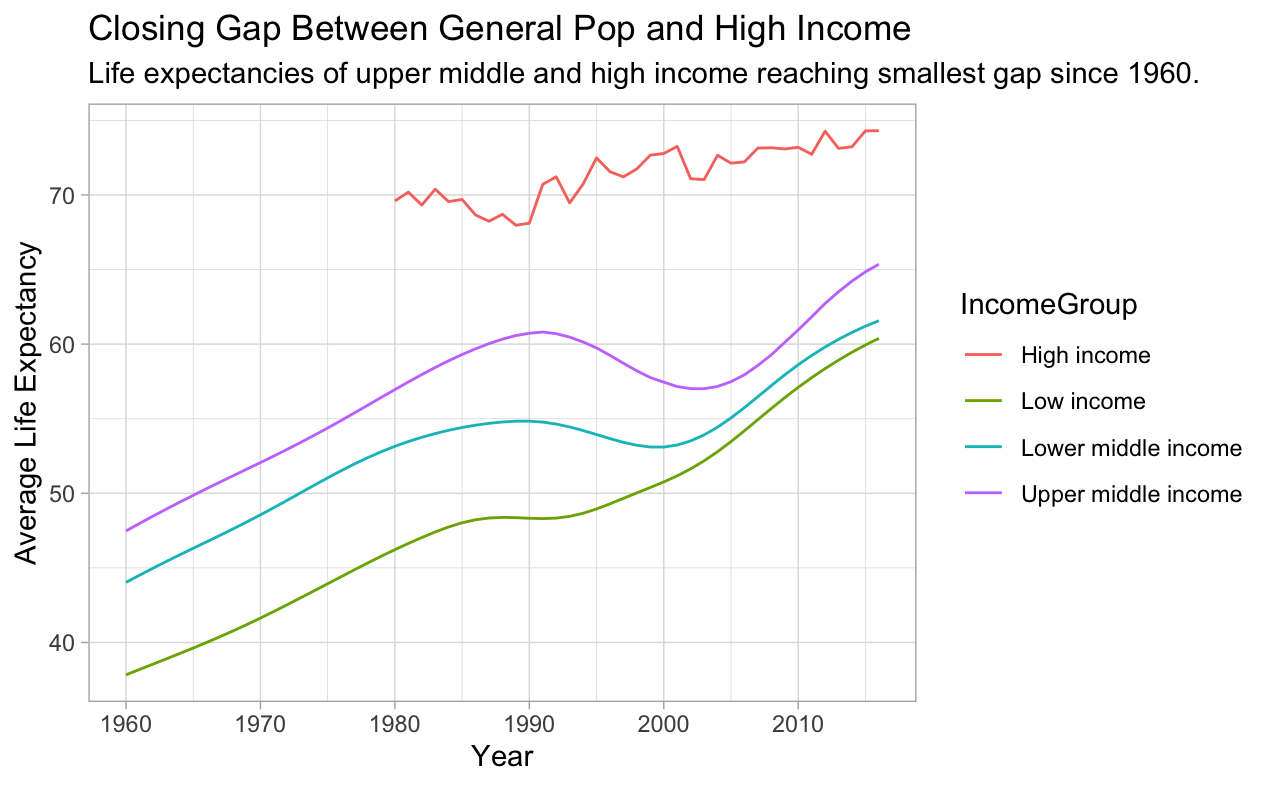
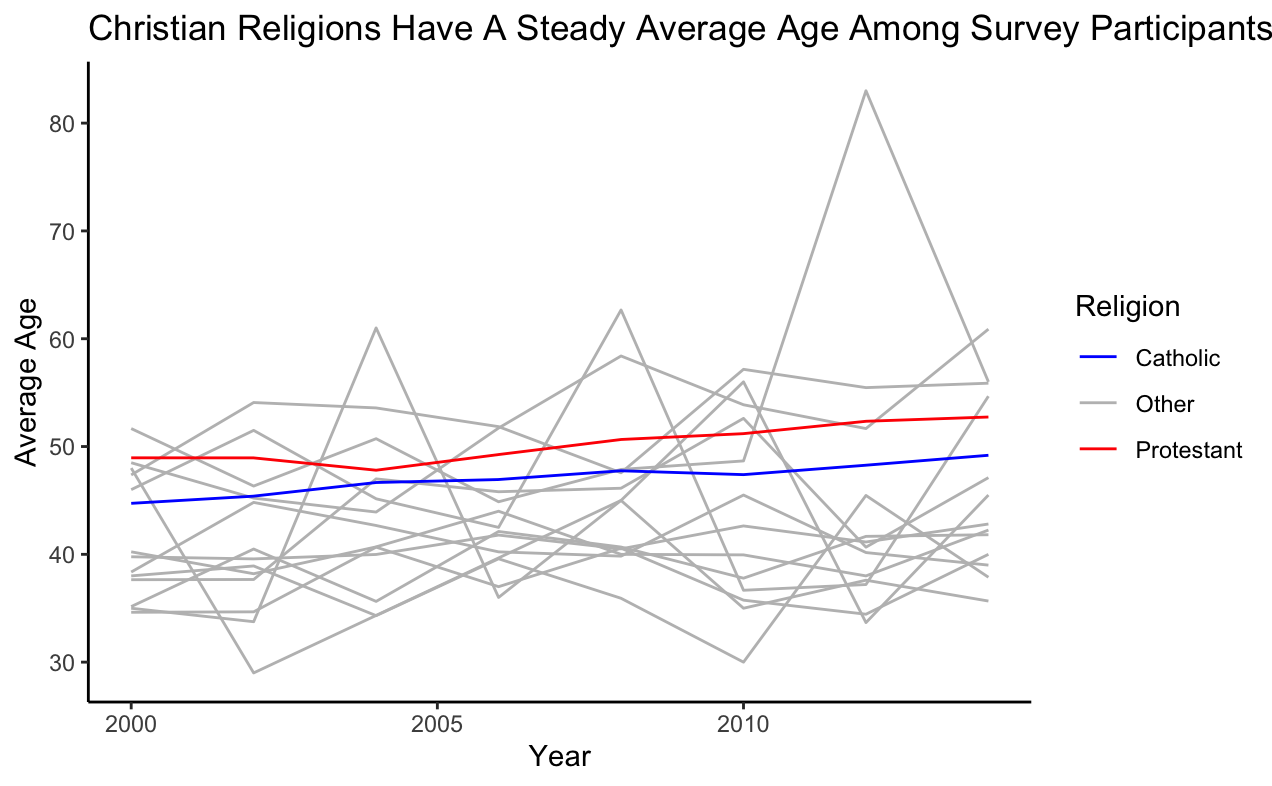
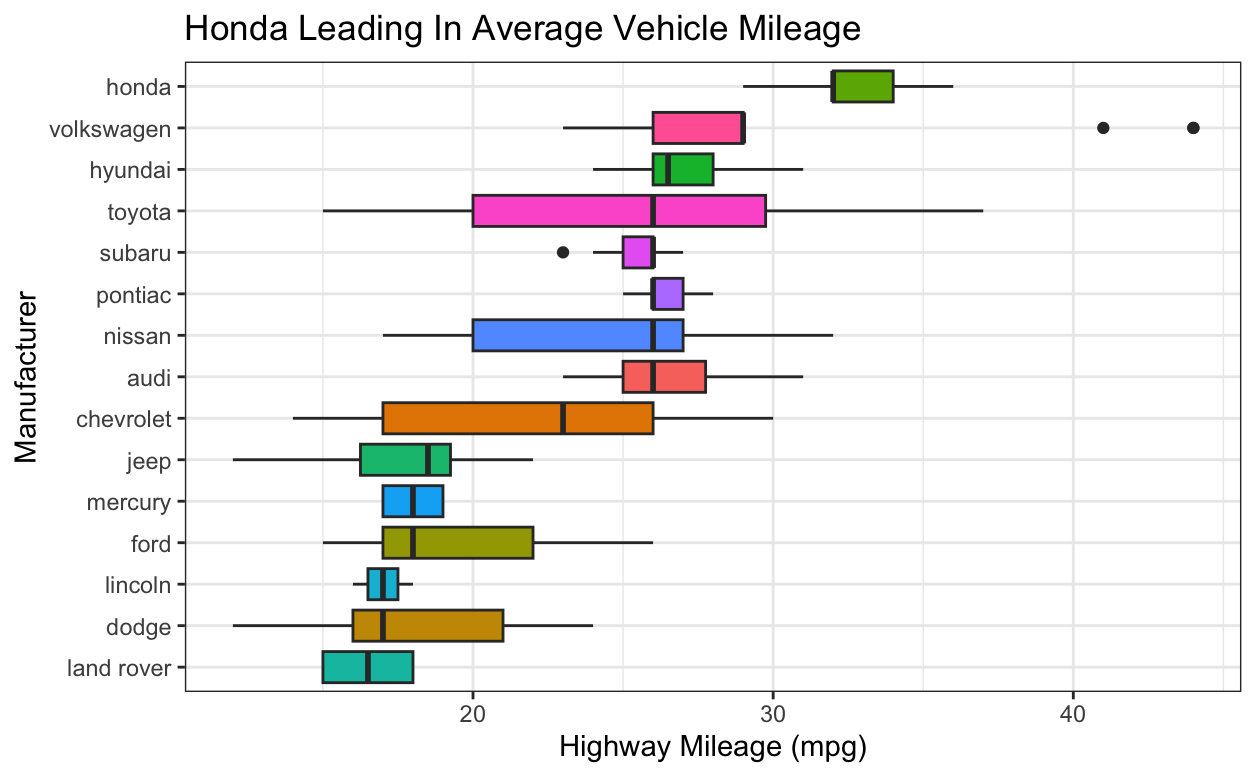
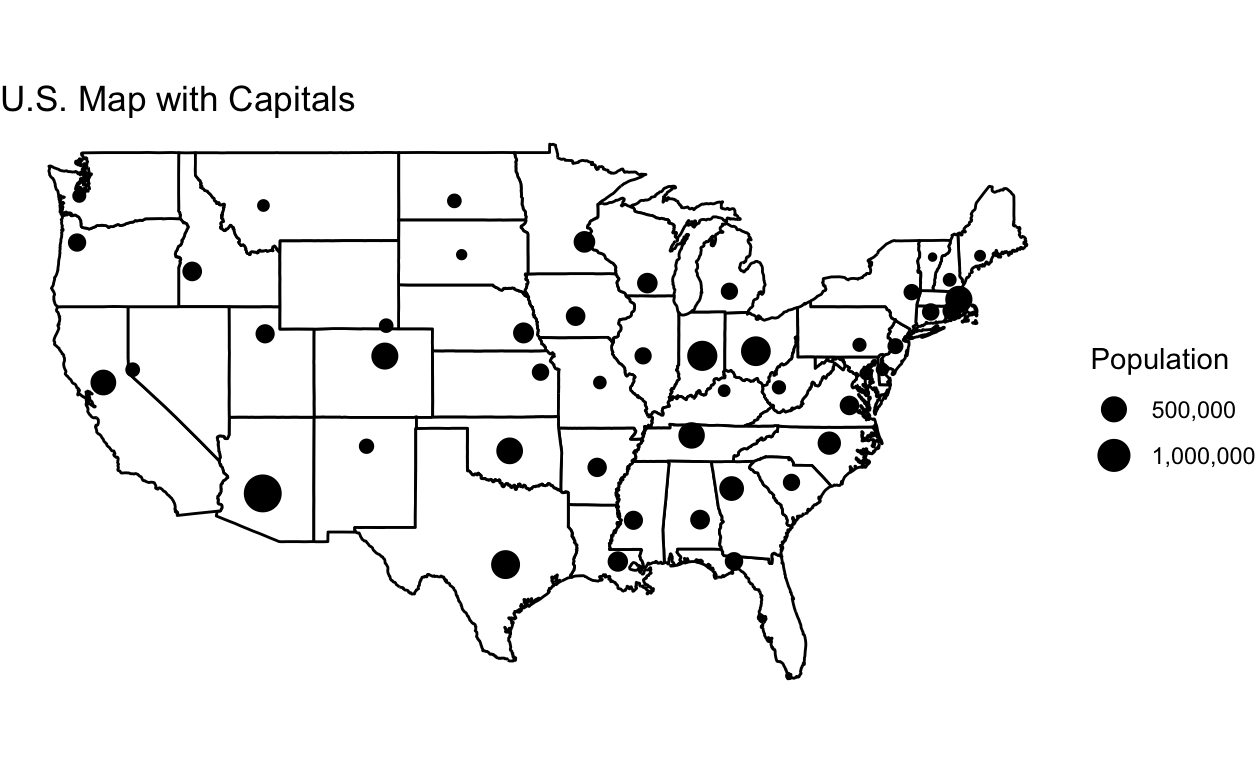
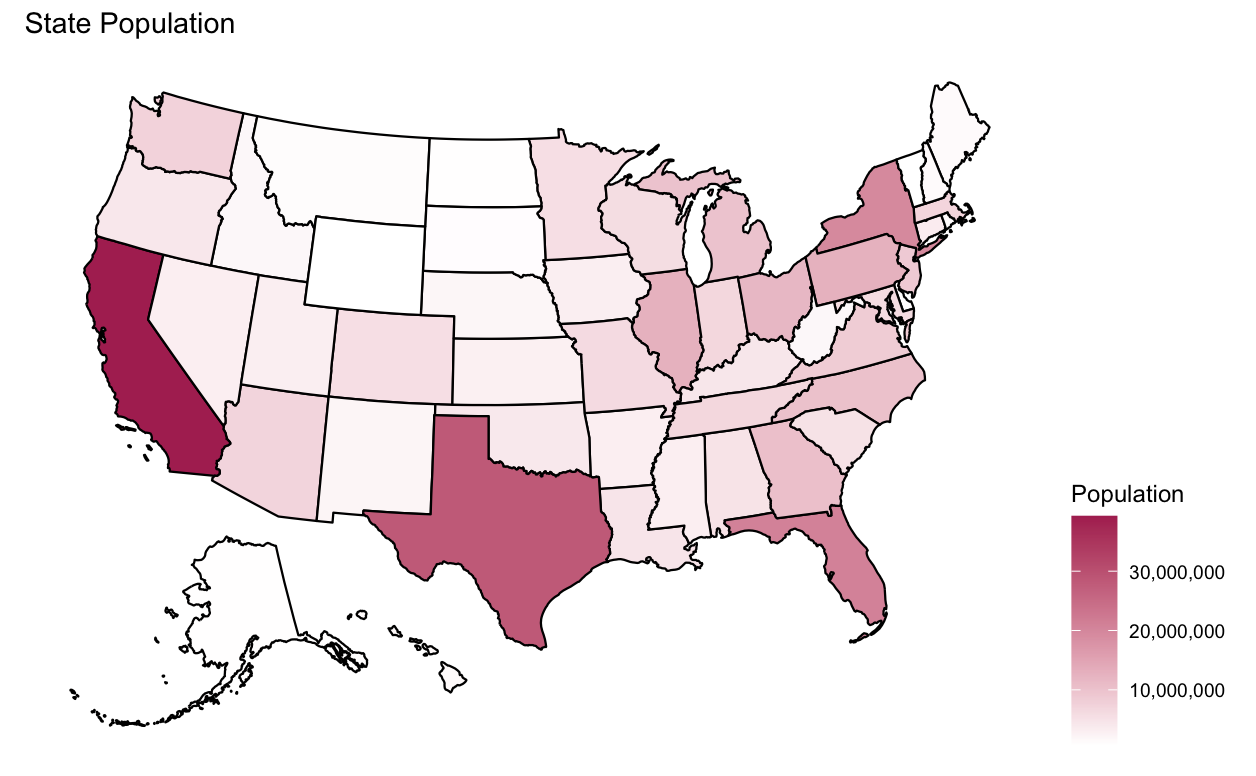
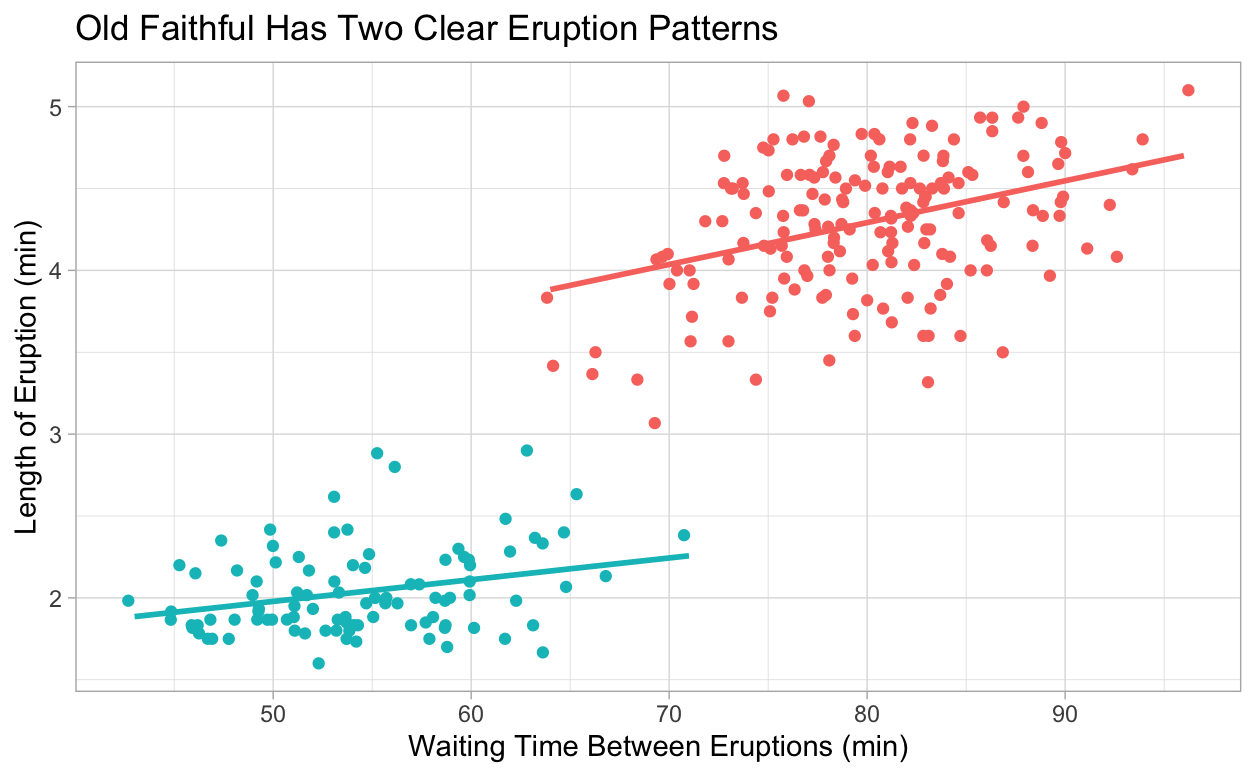
I have used RStudio primarily for data visualization and a little bit of data manipulation/cleaning. Below are a few examples of the graphs I created for my class, although I created many more over the course of the semester.
In this class, I also created a report in which I compiled, cleaned, and manipulated data to answer questions. It is available here for you to read.